Mind the Gap – Growth vs Value

By Bo Brownlee, CFA

October 2021

That Was Then

The exceptional divergence in performance between US Growth and Value stocks from the onset of the pandemic prompted many to believe that Growth stock valuations had not only outrun their fundamentals, but that they had entered bubble territory like that experienced in the TMT mania of the late 1990s.  Such thinking prompted the predecessor to this article in the early stages of the pandemic (SECOR Viewpoint: Are Growth Stocks Really that Expensive?, June 2020), that posited when Growth and Value stock valuations were considered in the context of their respective profit margins, not only were Growth stocks not in bubble territory, but were reasonably priced relative to Value stocks.  More specifically, Net Profit Margins of the Russell 1000 Growth and Value indices were scaled by their respective Price/Earnings (P/E) ratio, producing similar levels of profitability per P/E point, 0.41% for Growth and 0.40% for Value.

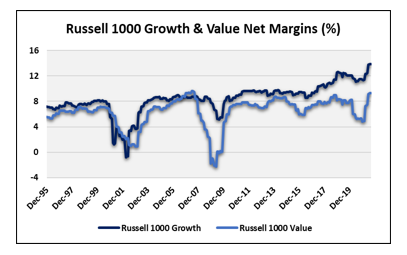
The impetus for this approach was an attempt to determine whether the relatively wide spread in margins between Growth and Value stocks that had developed over the preceding decade, perhaps justified the seemingly lofty P/E multiple accorded to Growth stocks.  This divergence in the relative profitability of the two styles has been driven primarily by the exceptional profitability of the technology platform giants that have come to dominate Growth indices.  The spread in Net Profit Margins between Growth and Value stocks had expanded to 5.6% in the Spring of 2020, in contrast to the much narrower 1.1% profitability differential at year-end 1999.  The software-centric business models of the Growth titans insulated them from the worst of the pandemic, unlike the cyclical-heavy Value indices that were more vulnerable to the slowing economy due to their higher fixed cost base.  The scalable business models of the largest Growth companies drove a steady increase in profit margins in recent years to underpin their valuations while Value companies enjoyed no such boost.  As a result of the superior profitability of Growth stocks, when relative valuations between the styles were considered in combination with their respective profitability, both were delivering roughly the same amount of profit margin per P/E point in the Spring of 2020.

This Is Now

However, as we emerge from the pandemic much has changed.  With the reopening of the US economy, Value companies’ profitability has snapped back.  Their high operating leverage, which served as a headwind in the pandemic-induced slowdown, has now become a tailwind as economic growth has resumed.  In the first half of 2021, Value earnings increased 43% from their year-end levels compared to 22% for Growth.  Expanding margins have fuelled the snapback in Value company earnings with profit margins expanding to 9.3% in September 2021 after bottoming at 5.2% in the middle of 2000.  Even with Growth profit margins also expanding from 11.2% to 13.8% over the same period, the spread between Growth and Value margins narrowed from 6.0% to 4.5%, enhancing the attractiveness of Value stocks in the profitability per P/E point framework.


Much has changed on the relative valuation side as well.  The spread in P/E multiples between Value and Growth stocks has continued to widen, despite the strong rebound in Value earnings and a modest performance revival after the announcement of effective vaccines near the end of 2020.  On the heels of that good news, Value stocks outperformed Growth stocks in the first half of 2021 by 4.7%, 18.0% for the Russell 1000 Value index versus 13.3% for the Russell 1000 Growth.

But going back to the end of 2019 before the pandemic’s impact was felt, Growth stocks have handily outperformed Value by 22.7% (36.5% for Growth, 13.8% for Value), more than overcoming the recent Value rally and continuing their decade-plus superiority over Value stocks.

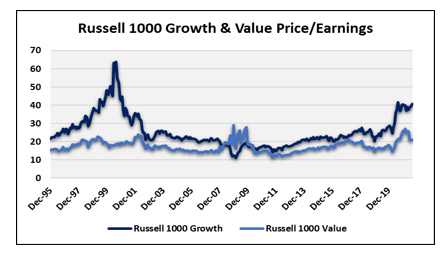
The long winning streak by the Growth style has pushed its P/E multiple to 40.5x its trailing twelve months earnings compared to 20.9x for Value stocks, as shown below.  While Value’s P/E has seen very modest expansion from the pre-pandemic year-end 2019 level of 18.1x, the P/E for Growth stocks has expanded considerably from its 28.3x reading at the end of 2019.


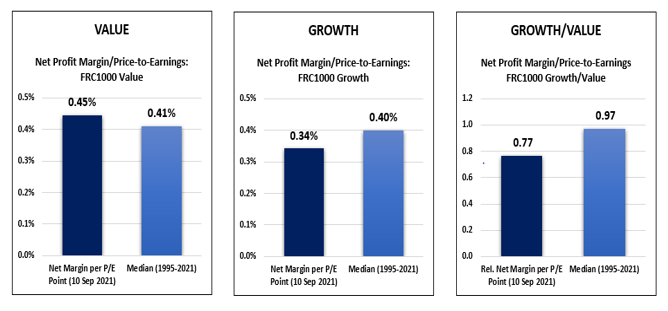
The combination of a narrowing profitability gap between the styles and a widening in the valuation gap between the two has resulted in Value stocks now appearing relatively attractive on a profitability per P/E point basis, a reversal from the early months of the pandemic. As of early September, Value stocks’ Net Profit Margin per P/E point stood at 0.45% versus 0.34% for Growth stocks.  Over the longer term from 1995, each style has delivered nearly the same amount of margin per P/E point, as shown below, with Value currently slightly above its long-term average and Growth stocks now below.


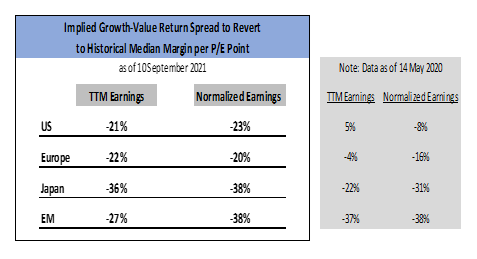
Assuming no change in relative profitability, we can solve for the relative return difference between styles that would return the relationship to its historical median level near par.  This calculation yields an implied outperformance by Value stocks of 21% versus Growth as of early September 2021.

This result is not merely a product of near-peak profit margins and earnings for the cyclical-heavy Value stocks either.  While profit margins for Value companies are indeed higher than their long-term average by approximately 2% today, those for Growth stocks are also elevated by more than 5% over their average level back to 1995; today’s margin advantage of 4.5% for Growth stocks is still more than double that of the 2.1% long-term average.  To address possible point-in-time distortions, earnings and margins can be normalized by calculating rolling averages for both Growth and Value stocks.  Using rolling five-year periods, this normalized calculation produces a similar result of Value stocks being undervalued by 23%.

Non-US Markets

Equity markets outside of the US are also in favor of Value when margins are considered in conjunction with valuation.  Europe, Japan and Emerging Markets all show implied Growth-Value return spreads similar to that of the US, summarized below.


While Value companies in all regions have enjoyed a rebound in profit margins as economies have reopened, the rebound has been especially pronounced in Europe due to its high sensitivity to the global economy.  Its index composition is more concentrated in economically sensitive sectors, such as Cyclicals and Financials than are other regions like the US and Emerging Markets that have a larger representation of higher growth technology-related companies.  This concentration has driven a sharp snapback in margins for Value companies, increasing nearly fourfold from 2% in the third quarter of 2020 to 7.6% a year later.

Despite the strong margin improvement in Europe, the Value opportunity appears brightest in Japan and Emerging Markets when considering valuation in the context of profitability. The case for Japan Value is driven by the extremely narrow profit margin advantage of Growth companies over Value companies – just 1.3% – despite a very wide spread in P/E multiples of 16.2x.  Compare this to the US where the spread in P/E multiples is also wide at 19.6x but where Growth stock margins exceed those of Value stocks by a much more substantial 4.5%.  The Emerging Market Value case is based more on relative P/E multiples, as Emerging Market Growth stocks are valued at 2.4x that of their Value counterparts, even higher than the 1.9x of the US.  This wide disparity in relative valuations exists even after the recent rout in Chinese technology stocks that dominate the Emerging Markets Growth index.  Additionally, profit margin contraction of those same China tech giants is almost a certainty given the recent regulatory crackdown which would further enhance the attractiveness of Value stocks in this framework.

Of course, Value investors have reason to remain skeptical that years of underperformance are about to reverse as previous Value rallies repeatedly stalled over the past fourteen years of this long and unrelenting Growth stock cycle.  So where is the Value trap most likely to be hiding among the regions considered here?  Europe Value may be the most likely candidate.  The sharp improvement in Value profit margins has restored its profit margin to 7.6%, within 0.5% of its pre-COVID level of 8.1%.  That level has only been surpassed once in the last 25 years when Value margins peaked at 9.9% in the fourth quarter of 2007, just before plummeting during the Great Financial Crisis.  The current elevated margin for European Value companies still pales in comparison to the US and Emerging Markets with profit margins of 9.3% and 10.2% and is only modestly higher than that of Japan at 6.4%.  Japan Value stocks, though, sell at only 12.2x what are likely near-peak margin earnings versus 15.1x in Europe.  Emerging Market Value is both cheaper and more profitable than Europe while US Value, although more expensive on a P/E basis also holds a wide edge in profitability.  Ultimately, attempting to identify a single market most susceptible to the proverbial Value trap may be just as futile today as it has been since this Growth cycle commenced with the Great Financial Crisis, sparing no region from Value underperformance.

Are We There Yet?

Despite favourable profitability-adjusted valuation metrics, Value stocks still face challenges in closing the return gap with Growth stocks.  In the near term, delays in reopening due to Delta variant concerns have disproportionately impacted the cyclical-heavy Value companies, especially in the Travel and Leisure sectors. Probably a more challenging task for value companies in the longer-term is in narrowing the persistent profitability gap with Growth stocks.  While Value margins in the US have fluctuated around an average of 6%, Growth margins have marched steadily higher from roughly 7% in the late 1990s to today’s 13% with only a few interruptions.  This margin expansion has been fuelled by the rise of the tech giants and their lucrative and seemingly unassailable platforms.  And unlike many Value companies that weakened since the onset of COVID, these companies are emerging from the pandemic with arguably stronger franchises and even more dominant market positions.

The case for Value stocks, though, is not without merit.  Investors have taken note of the high and growing margins for Growth stocks and have now assigned a P/E multiple to current earnings that can only be justified by continued rapid earnings growth and margin expansion relative to Value stocks.  Such high expectations ultimately make Growth stocks vulnerable to disappointment should they fail to deliver on those increasingly lofty expectations. The argument against further increases in Growth margins has been advanced many times over the past twenty years, however, and have repeatedly been proven wrong.  But there is a limit to how much further margins can expand before either attracting competition, or perhaps more likely, the intervention of regulation to foster increased competition. Indeed, the recent regulatory crackdown in China on its technology giants is perhaps a more draconian version of what is to come in the US where the Biden administration has signalled its intent to intensify scrutiny of its largest technology companies.  Finally, the days of repressed interest rates by Central Banks that have benefitted longer duration Growth stocks may be numbered as taper talk intensifies around the world, with the potential normalization of interest rates reversing a multi-year headwind for shorter duration Value stocks.

About the author

Bo Brownlee, CFA

Global Equity Strategist