The “Costless” Collar
Costless Collars are a popular equity hedging strategy, which appeals to investors by its simplicity and a promise of a free lunch: the portfolio appears to be protected and there are no initial cash outlays. In this note we evaluate this hedging approach and offer investors a framework to evaluate costless collars in 2023.
Introduction
Costless Collars are easy to understand. For example, an investor would be buying a one-year, 10% out-of-the-money (OTM) put option, which usually costs 4%-5% of the notional amount the investor is trying to protect. To offset the cost of the put, the investor is selling an OTM call option, picking such a strike that the total cost of the structure is zero. (Sometimes, investors implement a variation of the structure where puts are substituted with put spreads, allowing them to sell a further out-of-the money call. While the pay-off of that structure is different from the one we are describing the main conclusions would remain the same). It is important to note that calls typically trade at a lower implied volatility than puts. Since the Global Financial Crisis (GFC), in the US market investors would be selling approximately a 7% OTM call to finance a 10% OTM put. The following chart summarizes pay-off of such a structure combined with full equity exposure:
Historical Analysis
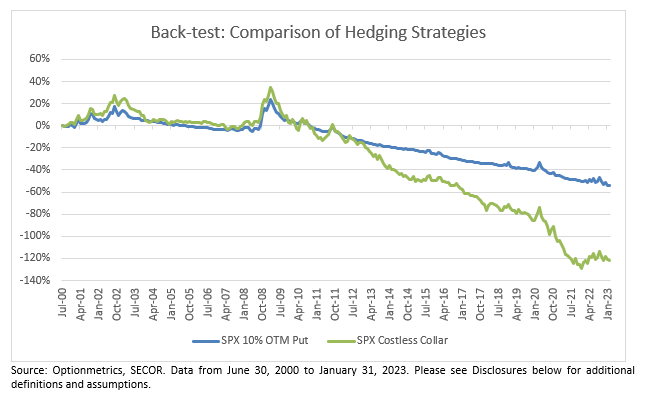
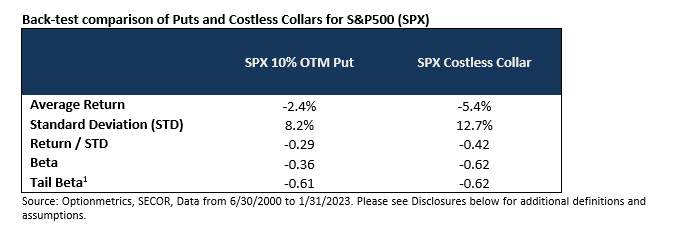
Many investors mention their negative experience with Costless Collars, particularly since the GFC. The following chart and the table illustrate that Costless Collars has historically been a poor choice for equity hedging. (To construct the back-test for both strategies we assumed that annual hedging structures are purchased every quarter. Thus, on each quarterly rebalancing the strategy holds 25% of 3, 6, 9, and 12-month options. This approach reduces dependence on a specific expiration point).
Clearly, buying Costless Collars systematically is not a great strategy. Over time it is very costly. For context, over this period US equities generated 6.4% return. To confirm that this analysis is not specific to S&P500, we constructed a similar back-test for Eurostoxx and tested it over available history that starts in 2003. The result was similar: -5.3% for Costless Collar compared with -2.8% for Puts. This is during the period when Eurostoxx generated a 6.6% annualized return.
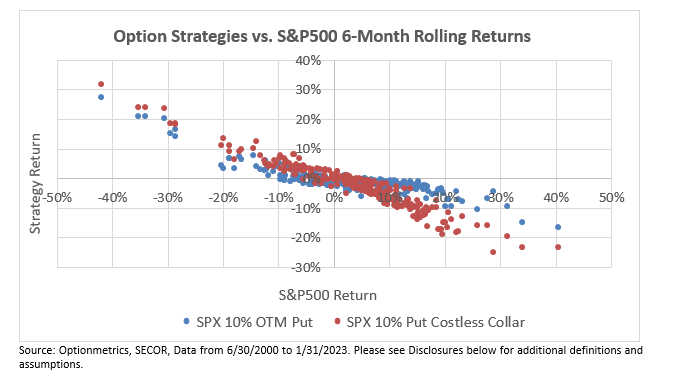
The table above also shows that while Puts have much more negative Beta to equities during market sell-offs (Tail Beta) than over the whole period, Costless Collar Beta is essentially the same in all periods. Thus, Costless Collars do not offer the asymmetric, convex profile that investors normally seek in their hedges. The following chart demonstrates this point visually: while Costless Collar returns are slightly better during market sell-offs (the difference is explained by the size of put premium), the strategy really underperforms during strong equity rallies.
Examples of costless collar performance under different market scenarios
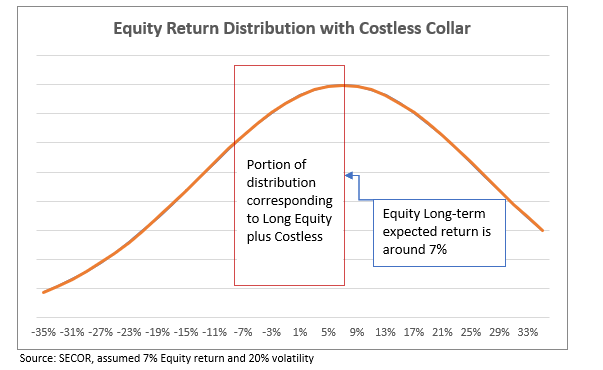
It may appear that if equity markets go up 7% on average, investors would not be giving away much of their long-term equity returns. There are a couple of problems with this logic. First, if expected return is around 7%, by selling 7% OTM calls investors cut off the whole right half of equity return distribution, while keeping a large portion of the distribution on the left side of the expected return line:
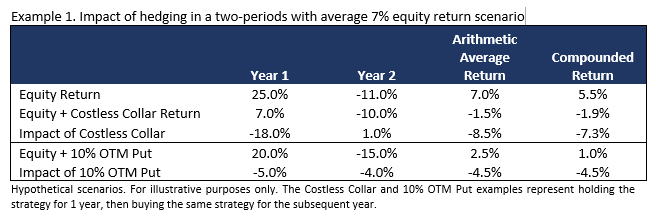
An even more important problem with Costless Collars becomes obvious when we consider a 2-period equity market scenario, presented in the tables below. In Example 1 the investor uses collars to hedge an equity portfolio over two years when equities realize a 7% average arithmetic return. The impact of having a collar is a large negative number: -8.5% in arithmetic terms and -7.3% if we consider impact of compounding. For comparison, impact of puts is much smaller even though the investor needed to outlay 5% premium two years in a row.
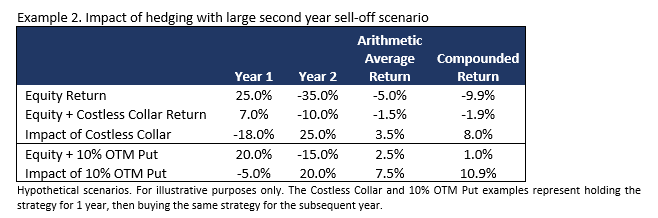
The Example 1 conclusions also hold if we assume that equity markets sell-off materially in Year 2 after a strong Year 1. Example 2 demonstrates that the impact of the first year is just too high to compensate for gains of the second year. Again, 5% outlay on puts ends up a cheaper option than the Costless Collar.
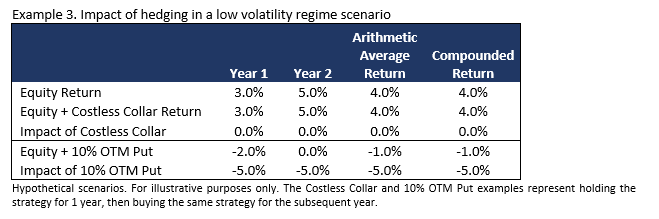
The situation where Costless Collars strategy shines is when equity markets are in a low volatility grind higher regime. Example 3 demonstrates a scenario where equity markets produce positive low single digit returns. In this case Costless Collars significantly outperform Puts.
These examples illustrate that Costless Collars represent a good hedging strategy in a low volatility environment. In the environment of high volatility with markets moving up and down significantly, investors may be better off with “costly” put protection.
Conclusion
We presented comparison of historical performance of Costless Collar Strategy with Put buying strategy. While there are historical periods and hypothetical scenarios when Costless Collars would outperform Puts, long-term track record indicates that Costless Collar strategy may result in significant losses for an investor.
[1] Tail beta is defined as the market sensitivity during tail-risk events.