See what Ken Frier’s viewpoint is on making sense of the current stock economy and its disconnect
By Ken Frier, CFA
June 2020
On average historically, changes in global equity prices have been closely related to changes in the global economy. This is fundamental to our understanding of how fair values for investment assets are derived. However, that has NOT been the case recently – despite the fastest and most severe contraction in the global economy of the past 70 years, stock prices are slightly higher than a year ago[1].
We are currently witnessing an unprecedented disconnect between the stock market and the economy, causing professional investors to ask ourselves: what are we missing? There have been many explanations, from monetary/fiscal policy to a surge of millennial day traders. What we all want to know is: how will the “Wall Street vs. Main Street” divide end?

While we do not know the answer to this question, this paper offers a methodology to quantify the stock/economy disconnect and analyses the outcomes of the large disconnects of the past. When these disconnects were extreme, stock market investors usually turned out to have been overly optimistic/pessimistic about what came next. Positive disconnects (stocks outperforming the economy, such as we observe today) led to losses for equity investors over the next year, and negative disconnects led to equity gains.
The chart on the following page shows the one-year global economic data change in black and the one-year return of global equities in blue[2]. These series have been closely related, with a correlation of 0.7. The timing of major turning points in the economy and stock market tends to coincide. The amplitude of changes in the economy and in stock prices tends to align as well. But not this year – on the right of the chart we can see that the stock market has not followed the economy downward.
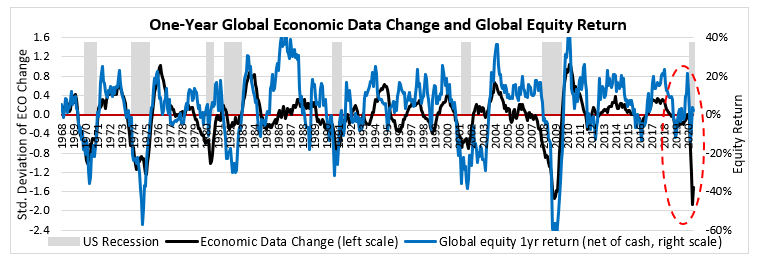
Using the data in the chart above, we can calculate the “disconnect”, the difference between how much stock prices changed in the prior year and the change in stock prices which would have been expected based on the change in the economic data. The disconnect is essentially the distance between the two lines on the chart above, translated into stock price terms. About two-thirds of the time the one-year change in stock prices has been within 10% of the amount implied by the change in economic data. Rarely (12% of the time) the stock/economy disconnect has been 20% or more. In May 2020, for the first time in this series, the disconnect went over 40%!
There should be stock/economy disconnects from time to time. The economic data are slow to arrive, reflecting a prior reality. The stock market is forward-looking, incorporating predictions about the future. If the global equity return has been much higher than what can be explained by the prior year change in the global economy, perhaps stock market investors are anticipating there will be a strong improvement in the economy in the year ahead. Also, there are other influences on stock prices besides economic growth. For instance, for most of the 1980’s, changes in interest rates were a key driver of stock market outcomes.
Disconnects beyond 20% are shown in the chart below, along with the cumulative global equity return (net of cash)[3]. In the red/green shaded periods, the prior year stock return was 20% or more above/below what would have been expected given the change in the economic data.
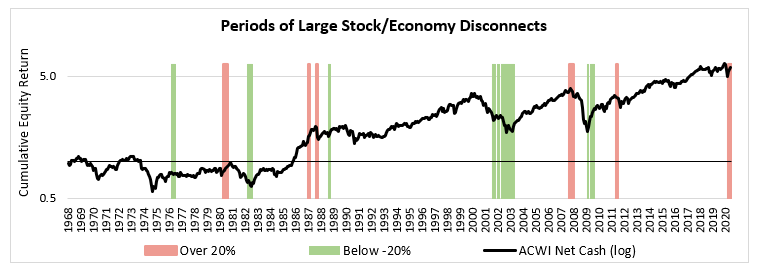
The surprising result of our analysis is that when the disconnects have been large, what happened next was often the opposite of what stock investors appeared to expect. On the prior chart, we can see that stock prices often fell after large positive disconnects (in red) and rose after large negative disconnects (in green).
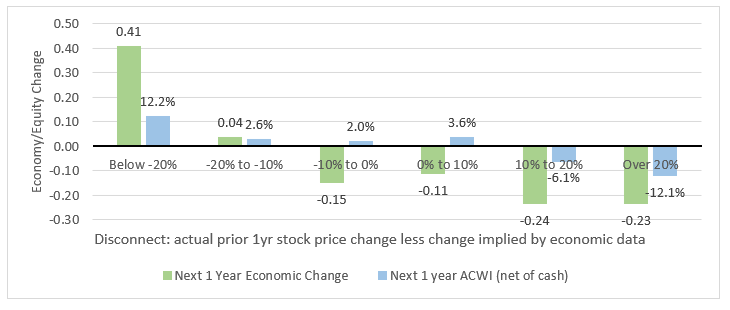
The chart below shows the average subsequent one-year change in the global economic data (number of standard deviations better/worse) and the one-year global equity return (net of cash) as a function of the starting disconnect[4]. We can see the more favourable subsequent outcomes for the economy and stock prices came after the periods when the stock market had fallen more than what was implied by the economic data. The least favourable outcomes for the global economy and stock market followed positive disconnects, such as we have today. This is a relatively small sample size, but it suggests that when stock market investors were out of alignment with the economic data they often turned out to be incorrect.
The positive disconnect today of 40% is unprecedented. If the global economy recovered completely in the next year – the full “V-shaped” recovery – while stock prices stayed about the same, that would resolve the disconnect. If stock prices fell 40%, with no improvement in the economy, that would resolve the disconnect as well. Of course, the stock market and economy could meet somewhere in the middle, with some combination of equity price decline and economic improvement in the year ahead.
Central bank activity has likely contributed to the scale of the current disconnect. Central banks are engaged in a sweeping program of creating money and purchasing fixed income securities, which has reduced yields, making investment in stocks relatively more attractive. Swift and aggressive stimulus spending by governments likely contributed to the disconnect as well. Moreover, some key economic releases in June have surprised on the upside, raising the probability that global economic growth is becoming positive.
However, even if the global economy is starting to recover, the current slump is having a material impact on corporate earnings. Estimated 2020 EPS for the ACWI index is $24 per share, down 25% from the $32 estimated when the year began[5]. Earnings are not expected to regain 2018 levels until 2021, meaning three years without earnings growth. As of June 2020, this adjustment downward and delay in earnings has barely impacted stock prices.
There are daunting obstacles which must be overcome for the global economy to recover fully. It appears that new coronavirus cases per day have started rising again in the US and they continue to rise globally. US health authorities recently expressed alarm about the possibility of coronavirus infections coinciding with flu season later this year. Economic activities which involve people being near one another will likely continue to be impaired while the virus threat remains. The slump in consumer demand is leading to a surge of bankruptcies. Aggressive deficit spending has been crucial in reducing the harm to individuals and businesses but cannot be sustained at the initial intensity. Eventually, a decline in government spending will offset economic growth from the private sector. Despite the recent improvement in some economic data, the IMF just lowered their 2020 world GDP growth projection to -4.9%[6].
To conclude, all patterns in investment history have exceptions, and the enormous scale of the current fiscal/monetary policy intervention may mean that the historical evidence is less relevant to today’s market. As this paper shows, on average historically when stock/economy disconnects have been large the future economic expectations implied by stock prices have not been realized. Stock market investors subsequently adjusted to the gap between expectations and reality, with stock prices falling after large positive disconnects and rising after large negative disconnects. This suggests that in situations like the current one, in which stock market returns have been much higher than what would have been expected based on the economic data, it has been worthwhile to defend equity portfolios against losses.
[1] Source Bloomberg. Using MSCI ACWI Local Index (MSELACWF), June 22, 2019 to June 23, 2020
[2] Source Bloomberg, SECOR Analysis. Economic change is GDP-weighted composite of 1-year change in global economic data. See endnotes. Equity return includes dividends and is net of cash return. 1/31/68 to 6/23/20
[3] Source, Bloomberg, SECOR Analysis. Disconnects which can be justified by bond price changes excluded.
[4] Based on average subsequent outcome when disconnect was in the specified range, monthly observations from January 1968 to June 2019. Periods in which interest rate changes were dominating equity outcomes (trailing stock/bond correlation over +0.50, as often in 1980’s, rarely since 1999) excluded.
[5] Source: Bloomberg, MSCI ACWI Index (MXWD)
[6] “World Economic Outlook Update, June 2020”, www.imf.org, June 24, 2020
