Stagflation: Four Decades Ago Versus Today – Similarities & Differences
By Edgar Sullivan, CFA
April 2022
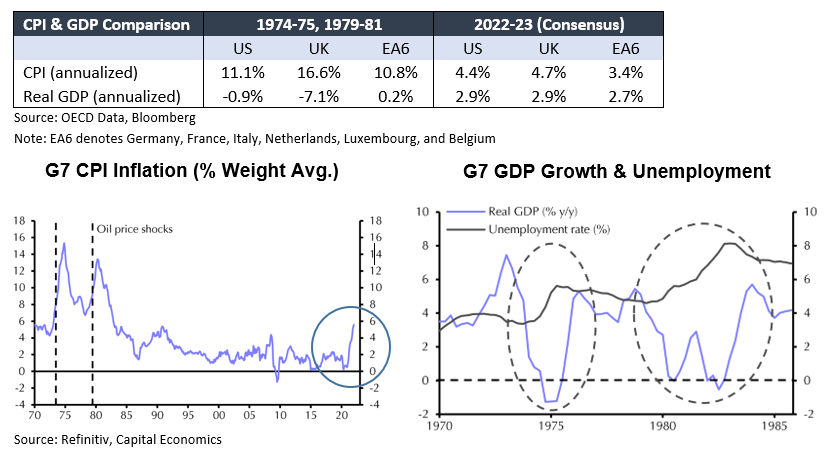
The hallmarks of the stagflation that beset the global economy in the mid-1970s and early 1980s — surging commodity prices, accelerating inflation and decelerating economic growth — are much in evidence currently. Commodity prices are up more than 60% from a year ago. Inflation in the world’s major developed-market economies is increasing at the most rapid rate in four decades, and the OECD has just reduced their forecast for global GDP growth for this year by 1.1%-points. Despite the parallels between the stagflation of some forty-years ago and the latest economic reports, the similarities are less clear cut when we consider the levels at which inflation and interest rates are likely to peak and the severity of the accompanying economic weakness.
Our conclusions are supported by representative forecasts and the significant structural changes that have occurred over the past four decades. In fact, in the current environment when forecasters are trying to assess many unprecedented factors, we find it somewhat reassuring that the rationale for our conclusion is largely based on the structural changes that have taken place over the past four decades and not solely on model output.
Current Macroeconomic Backdrop Versus Mid-1970s & Early 1980s
The global economy at the start of the year appeared to be well positioned for above-trend growth and the inflationary spike that accompanied the re-openings following the brief but severe 2020 pandemic-related recession was expected to moderate. But as Russia prepared to and then eventually invaded Ukraine renewed severe upward pressures were exerted on commodity prices and inflation forecasts were raised, while growth forecasts were lowered.
The latest acceleration in global inflation is broad-based across the developed and emerging market economies with the notable exception of China. Based on the current consensus forecasts, the CPI increases for the US, Euro Area, and UK are expected to approximate 5.5% – 6.5% this year, up ~2%-points from a few months ago. Forecasts for 2022 GDP growth for the major DMs are now in the 3% – 4% range, down 0.5% -1%- points.
The global economy is in a weaker position than a few months ago and the consensus outlook for 2022-23 may turn out to be optimistic. But when we compare today’s inflationary pressures and growth outlooks with their predecessors of some forty years ago significant differences are apparent. G7 inflation was already rising at a 9% rate prior to 1973 oil shock after which it peaked at 16% in 1974. The contrasts between the slowing in growth that is forecast for this year and the mid-1970s experience when G7 GDP contracted by 2% between 1973 and 1975 are also substantial.
Material Structural Differences Between Today’s Global Economy & 40 Years Ago
More significantly, we believe the following structural differences provide compelling support for concluding that the pace of inflation and economic slowing in 2022-23 will fall far short of the 1970s and early 1980s stagflation experience.
i. Higher Level of Confidence in Central Banks —The decisive actions that the major central banks took in the early-1980s and the sound policies that they have largely followed subsequently have earned considerable credibility for them. Some forty-years ago when the Volcker-Fed was trying to suppress double-digit inflation “Bond Vigilantes” pushed the yield on 10-year Treasuries to a peak of 15.8%. Today the yields on the 10-year sovereign bonds of major Developed Markets are less than 3%.
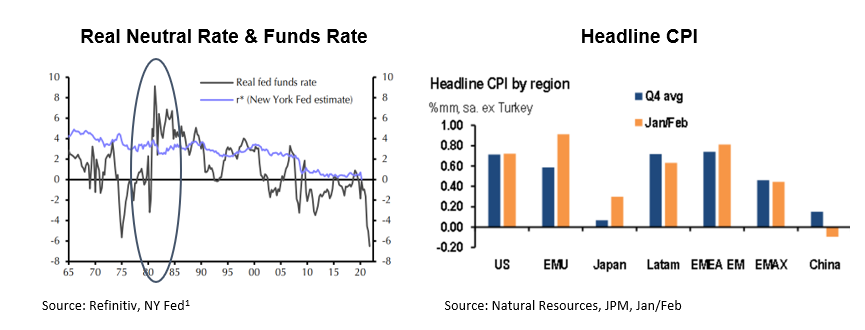
ii. Lower Neutral Policy Rates. Due to the significant structural changes— demographics, productivity growth and desired saving — that have taken place over the past four decades the nominal-neutral policy rate is currently ~ 2.5% versus ~ 6.5% some 40 years ago1.
iii. Supply-Side Distortions – A significant portion of the current inflation spike is due to pandemic-related distortions — e.g., goods/services demand imbalances, chip shortages, bottlenecks. Thus, a sizable portion of the current inflationary pressures should subside as these distortions abate. In the early 1980s the Volcker Fed had to raise interest rates far above the neutral rate (r*) to dampen the wage-price spiral that had developed because of previously loose policies.
iv. Energy Intensity Has Decrease Significantly — Oil and natural gas intensity per dollar of global GDP in the 1970s was equivalent to ~6% and ~4% of global GDP, respectively, versus ~2% each currently.
Concluding Thoughts / Caveat
The principal purpose of this report is to help investors better delineate the risks in the current environment. It is not intended to minimize them. Although suppressing the current inflationary spike is not likely to result in interest rates and unemployment rates rising to the double-digit levels that accompanied the late-1970s/early-1980s policy prescriptions of the Fed, BoE, and most of the E6 central banks, we cannot be assured that a soft-landing will be achieved. Many challenges lie ahead for central bankers as they try to normalize policies without pushing their rates much above normal and totally suppressing growth.
Inflation expectations and wage pressures, particularly in the US and in the UK bear watching. Our case for cautious optimism is based on the supposition that the increased credibility that central banks have earned over the past four decades will keep long-run inflation expectations contained and that more competitive product and labor markets will lessen the likelihood of a sustained wage-price spiral taking hold. Against this background, we believe that success is possible but far from assured.